memes.cjtrowbridge.com
Category: Anti-Capitalism - Housing -> This Meme
llama-3.2-vision
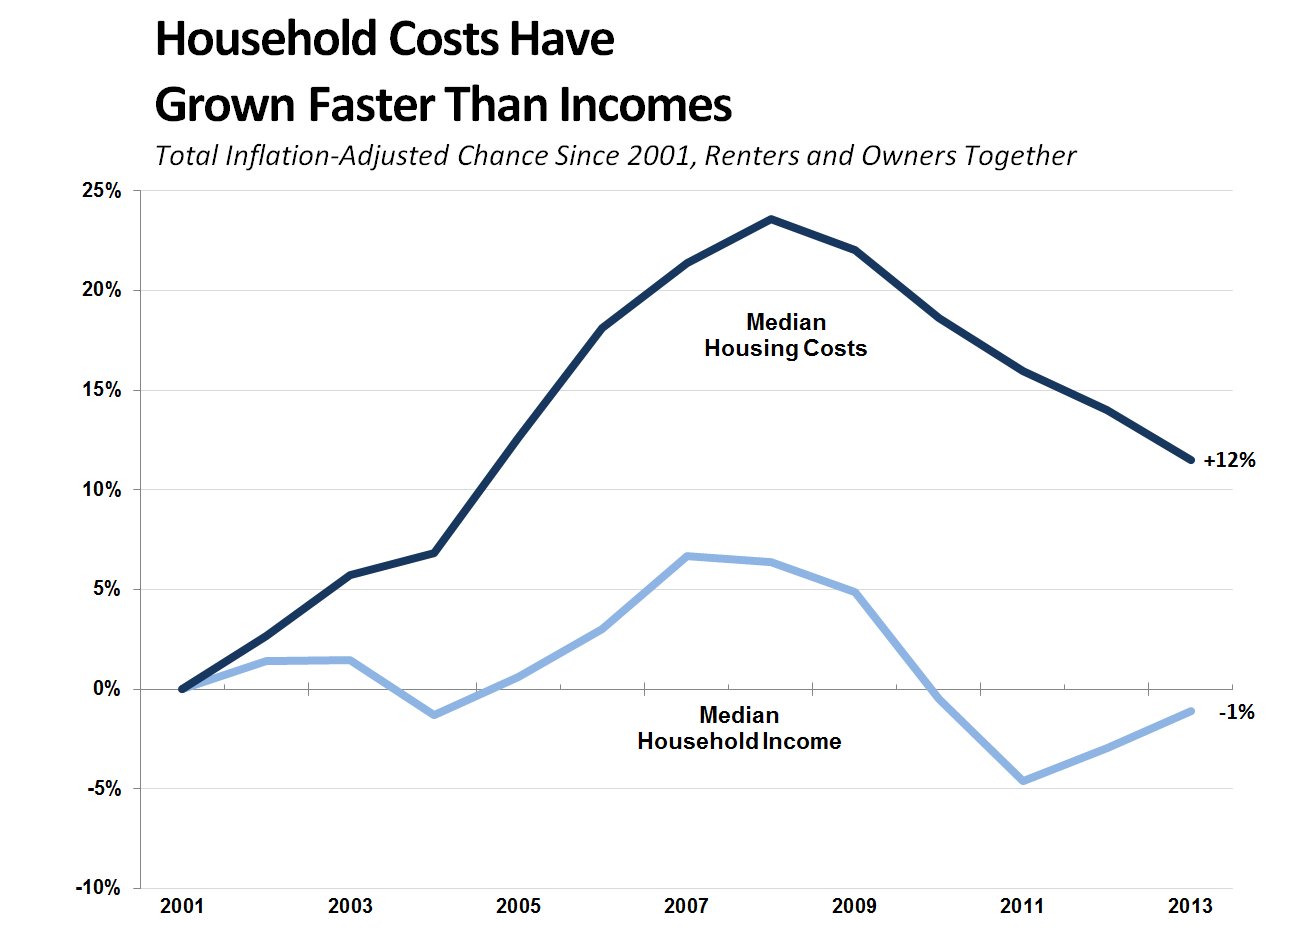
The meme is a graph showing the relationship between household income and the percentage of household income spent on housing. The graph shows that from 2001 to 2013, the percentage of household income spent on housing increased significantly, with the median household income decreasing by 10% while the median housing cost increased by 12%. The graph is captioned "Household Costs Have Grown Faster Than Incomes".
first-seen
2023-09-16T01:06:56+00:00
tesseract
Household Costs Have Grown Faster Than Incomes Total Inflation-Adjusted Chance Since 2001, Renters and Owners Together 25% 20% Median Housing Costs 15% +12% 10% 5% 0% Median -1% Household Income 5% -10% 2001 2003 2005 2007 2009 2011 2013